How to Map Your Integration Flow
By now, you’ve learned what integrations are and explored how restaurant systems exchange data — from the POS to payroll, vendors, and accounting.
Now it’s time to put that knowledge into action.
In this exercise, you’ll create your own System Integration Flow Diagram, showing how data moves between five or more systems in a connected restaurant environment.
This map is your visual proof that you understand how the entire restaurant ecosystem fits together.
1. Why Mapping Matters
Systems managers don’t just fix technology — they see technology.
They understand how information moves across platforms and where breakdowns can occur.
By drawing an integration flow, you make that invisible movement visible.
A good Integration Flow Diagram helps you:
- Understand dependencies between systems.
- Communicate technical details to non-technical teams.
- Identify where support tickets or delays might originate.
- Document your restaurant’s digital architecture in one snapshot.
This is the kind of document leaders and vendors use to plan upgrades, troubleshoot problems, and train staff.
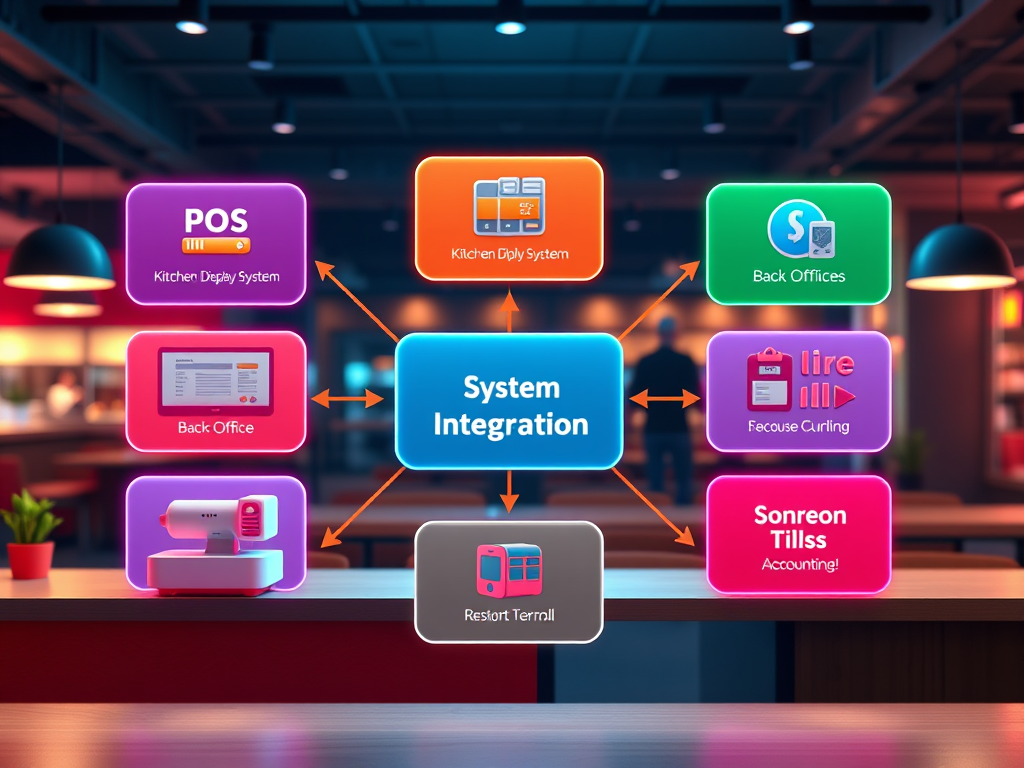
2. Step 1 — List the Systems in Your Restaurant Ecosystem
Start by listing at least five systems that commonly appear in a restaurant operation.
You can use real examples (from your workplace) or generic categories.
Example list:
- POS (Point-of-Sale)
- KDS (Kitchen Display System)
- Back-Office / Reporting System
- Payroll / Workforce Management
- Vendor / Inventory System
- Accounting / Financial System
Optional: You can include other systems like online ordering, loyalty, or catering if relevant.
Once you have your list, place them on your page — left to right, top to bottom, or in a circular layout. The order doesn’t matter as long as it’s logical to you.
3. Step 2 — Define the Data That Moves Between Systems
Next, identify what flows between each connection.
Ask yourself: “What kind of information travels from this system to that one?”
Here’s an example flow to get you started:
| From | To | Data That Moves |
| POS | KDS | Orders, item details, modifiers, timing info |
| POS | Back Office | Sales, labor hours, discounts, taxes |
| Back Office | Payroll | Employee punches, job codes, pay data |
| POS | Vendor System | Item-level sales, inventory usage |
| POS | Accounting | Daily sales summary, tenders, tax data |
This becomes your content for arrows and labels in your diagram.
4. Step 3 — Draw Your Integration Flow Diagram
You can create your diagram in Canva, Google Drawings, PowerPoint, Miro, or even on paper.
Follow these steps:
- Draw boxes for each system you listed.
- Use arrows to connect systems that share data.
- Label each arrow with the data being transferred (e.g., “Sales + Labor,” “Menu Updates,” “Payroll Exports”).
- Use directional arrows to show data flow direction (who sends and who receives).
- Optionally, color-code by data type:
- 💰 Finance / Accounting
- 👩🍳 Operations / Kitchen
- 📊 Reporting / Analytics
- 🕒 Labor / Payroll
Example:
POS → KDS → Back Office → Payroll → Accounting → Leadership Dashboard
The goal is clarity, not complexity. Someone unfamiliar with your restaurant should be able to glance at your diagram and understand how data travels.
5. Step 4 — Add Notes and Observations
Under your diagram, write 4–6 bullet points summarizing your insights:
- Which system acts as the source of truth?
- Where is data most vulnerable to errors or delays?
- Which integration is real-time vs. batch (nightly uploads)?
- What teams are responsible for maintaining each connection?
This section turns your drawing into a professional document — one you could use in an interview or project presentation.
6. Step 5 — Deliverable: The System Integration Flow Diagram
Your deliverable should include:
- Title: System Integration Flow — Restaurant Ecosystem
- Diagram: showing at least five systems and the data moving between them.
- Notes/Observations: short bullet points about data flow and dependencies.
This document becomes a permanent part of your Restaurant Systems Blueprint Portfolio — evidence that you can analyze, visualize, and communicate complex system relationships clearly.
7. Reflection Questions
- Which integration path surprised you most while mapping?
- Where would you focus your monitoring efforts if you were managing this system?
- How might a small data error in one system affect the rest of the flow?

Leave a comment